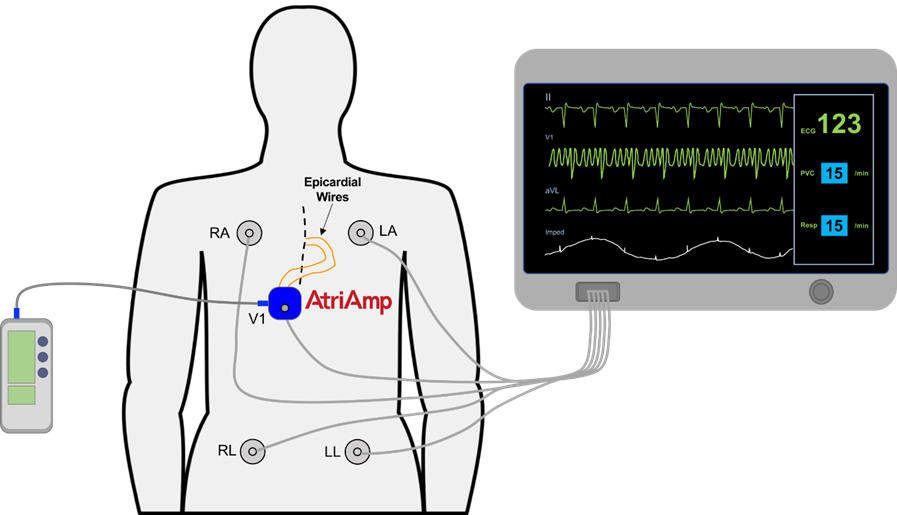
Accurate rhythm diagnosis requires identification of both the atrial and ventricular signals on the ECG. The stepwise process described below will require comparison of the surface electrogram and the atrial electrogram to accurately identify the atrial and ventricular signals. To more easily compare the two electrograms, the AEG should be displayed concurrently with the surface electrogram (as seen on the monitor below). When using the AtriAmp, as seen below, the V1 lead displays the AEG. Lead II and aVL represent two of the surface ECGs in this figure.
Stepwise process of interpreting the AEG
Step 1: Identify the ventricular signal on the surface electrogram. These are typically easy to identify. The red box below outlines one of the ventricular signals on the surface electrogram for an idealized ECG showing an atrial ectopic rhythm.
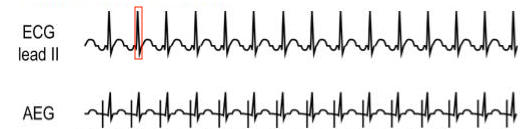
Step 2: Identify the ventricular signal on the AEG. As both the surface electrogram and the AEG are obtained simultaneously, the ventricular signals on the AEG and surface ECG will be at the same position on the time (X) axis.
Step 3: Identify the atrial signal on the AEG. The atrial signal is usually identified on the AEG as a separate sharp deflection that is smaller in amplitude or not easily visible on the surface ECG. In many cases the atrial signal is separate from the ventricular signal, but in some arrhythmias there may be overlap of the atrial and ventricular signals. Below is an idealized example followed by two patient examples. Red boxes outline an example of the ventricular signals and blue outlines an atrial signal.
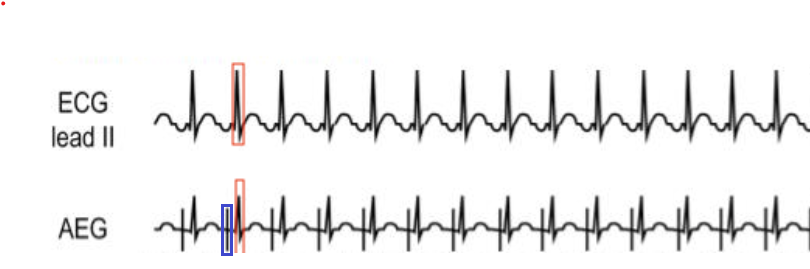
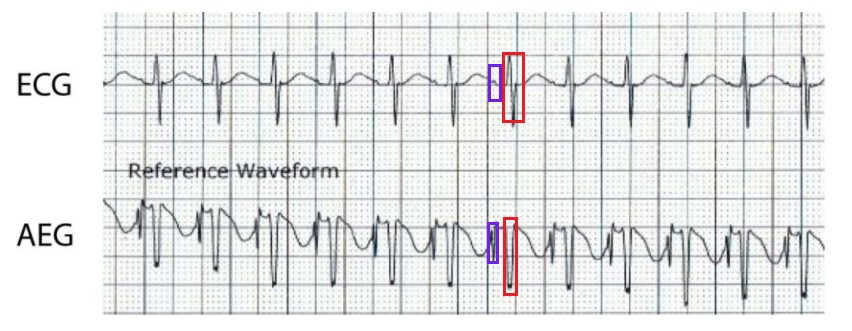
Patient Example 1: The AEG is the lower lead. Notice the sharp atrial deflection near the end of the T wave, easily visualized on the AEG but challenging to identify on the surface ECG. Red box shows a ventricular signal and blue shows an atrial signal.
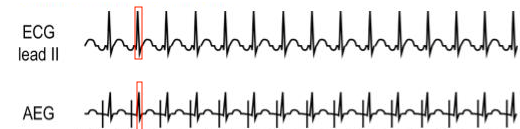
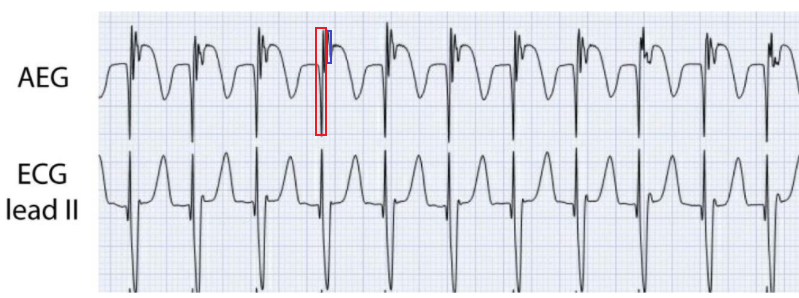
Patient Example 2: A patient in junctional ectopic tachycardia. The AEG is the top lead. Notice the easy to identify ventricular signals on both the surface and AEG. In this case, though not visible on the surface ECG, the atrial signal is easily identified as a larger deflection not seen on the surface electrogram, overlapping the terminal QRS in the AEG. The red box shows a ventricular signal and blue shows an atrial signal.
Step 4: Complete labelling Atrial and Ventricular signals for the entire AEG to determine the relationship between the atrial and ventricular signals
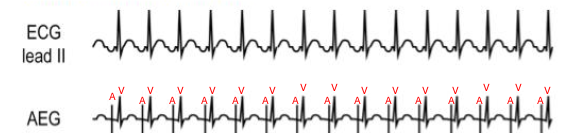
Once the atrial and ventricular signals are identified, rhythm analysis can begin.